
Gateways
The gateway is a critical component of every Critical Labs installation. It is what connects to all of your equipment, reads sensor data, and sends that information to the cloud to be processed.
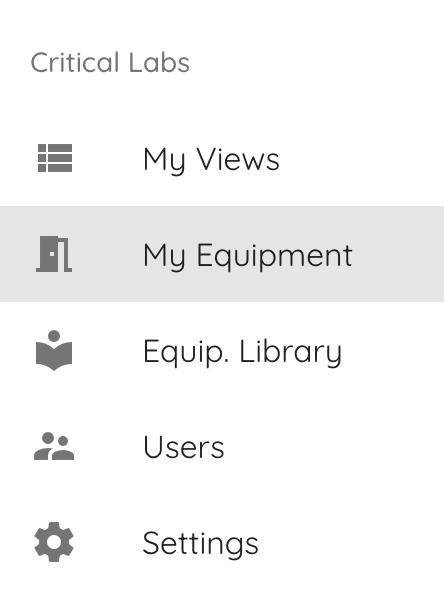
To view your gateway/gateways in Critical Labs, Login at criticallabs.com, select a company, then open up the navigation menu (three dots in the top righthand corner) and select My Equipment.
You should now see all of the gateways that you have connected to your company. This page also shows an icon to the left of the gateway name to indicate if the gateway is connected or disconnected. The text below shows the last time it reported data to the cloud.
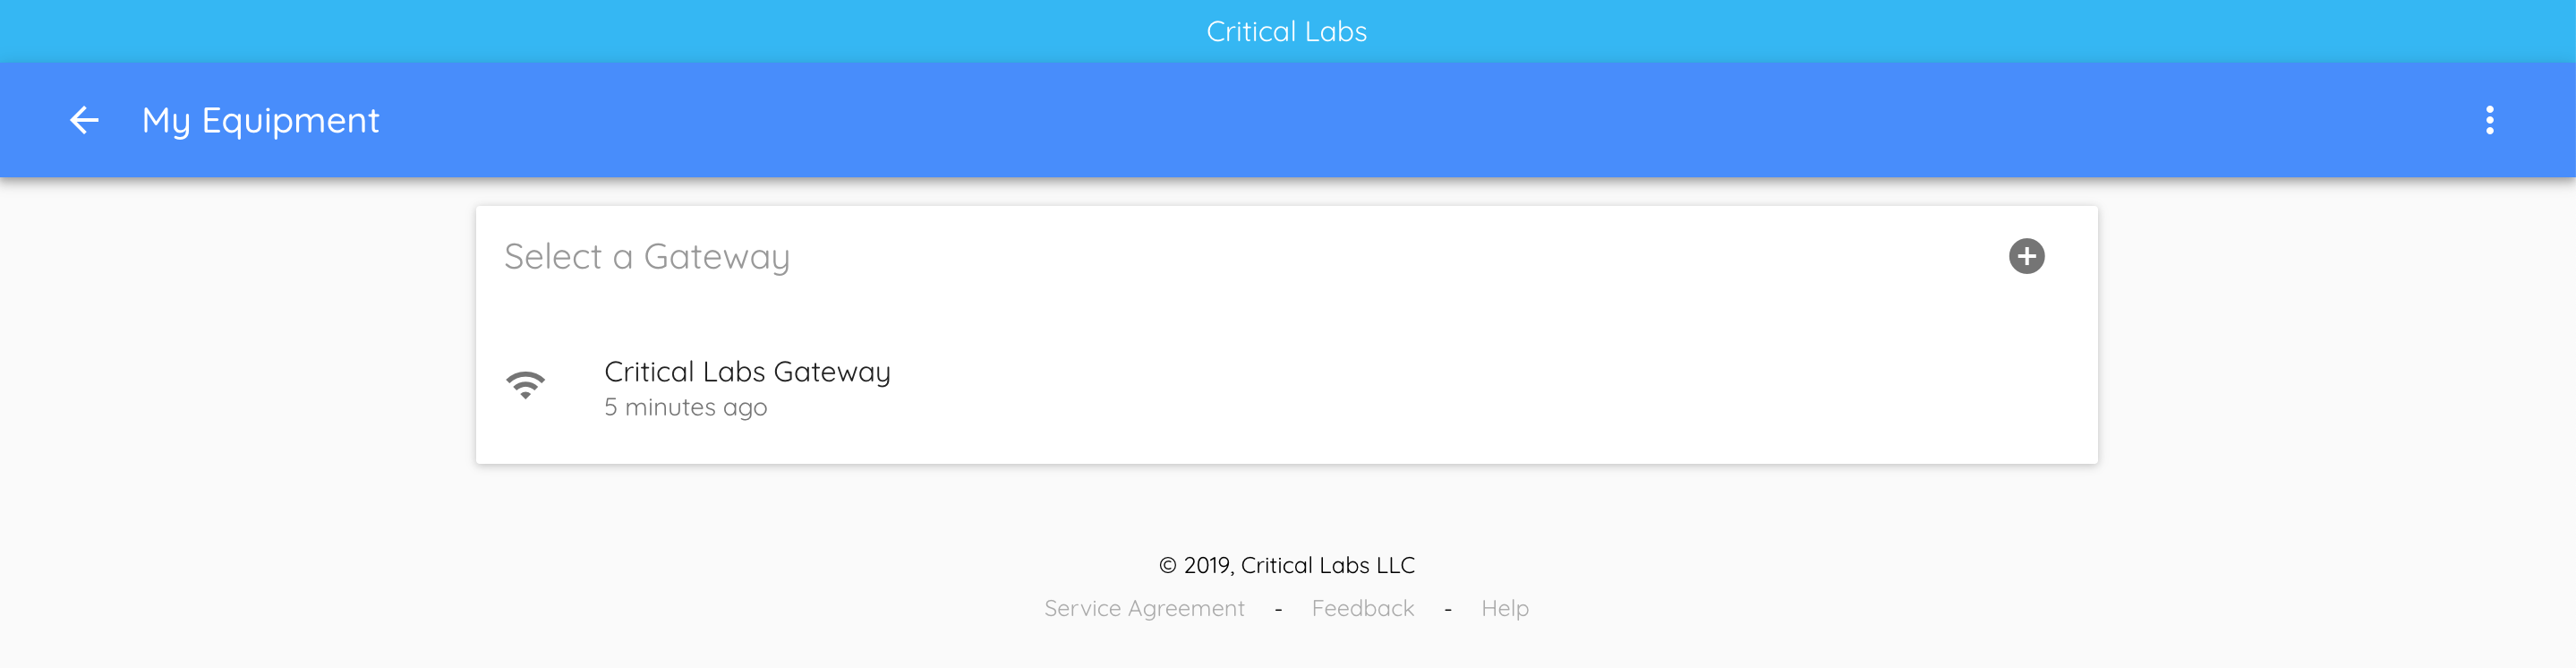
Click on one of the gateways in the list to go to the gateway's status page. Here you will find more detailed information about the gateway on the left side of the page, and a list of connected devices on the right side.

Let's look at a piece of equipment - click on one of the equipments listed on the right hand side of the page. *Don't have any equipment listed? Checkout the "Adding Equipment" section below.
Equipment
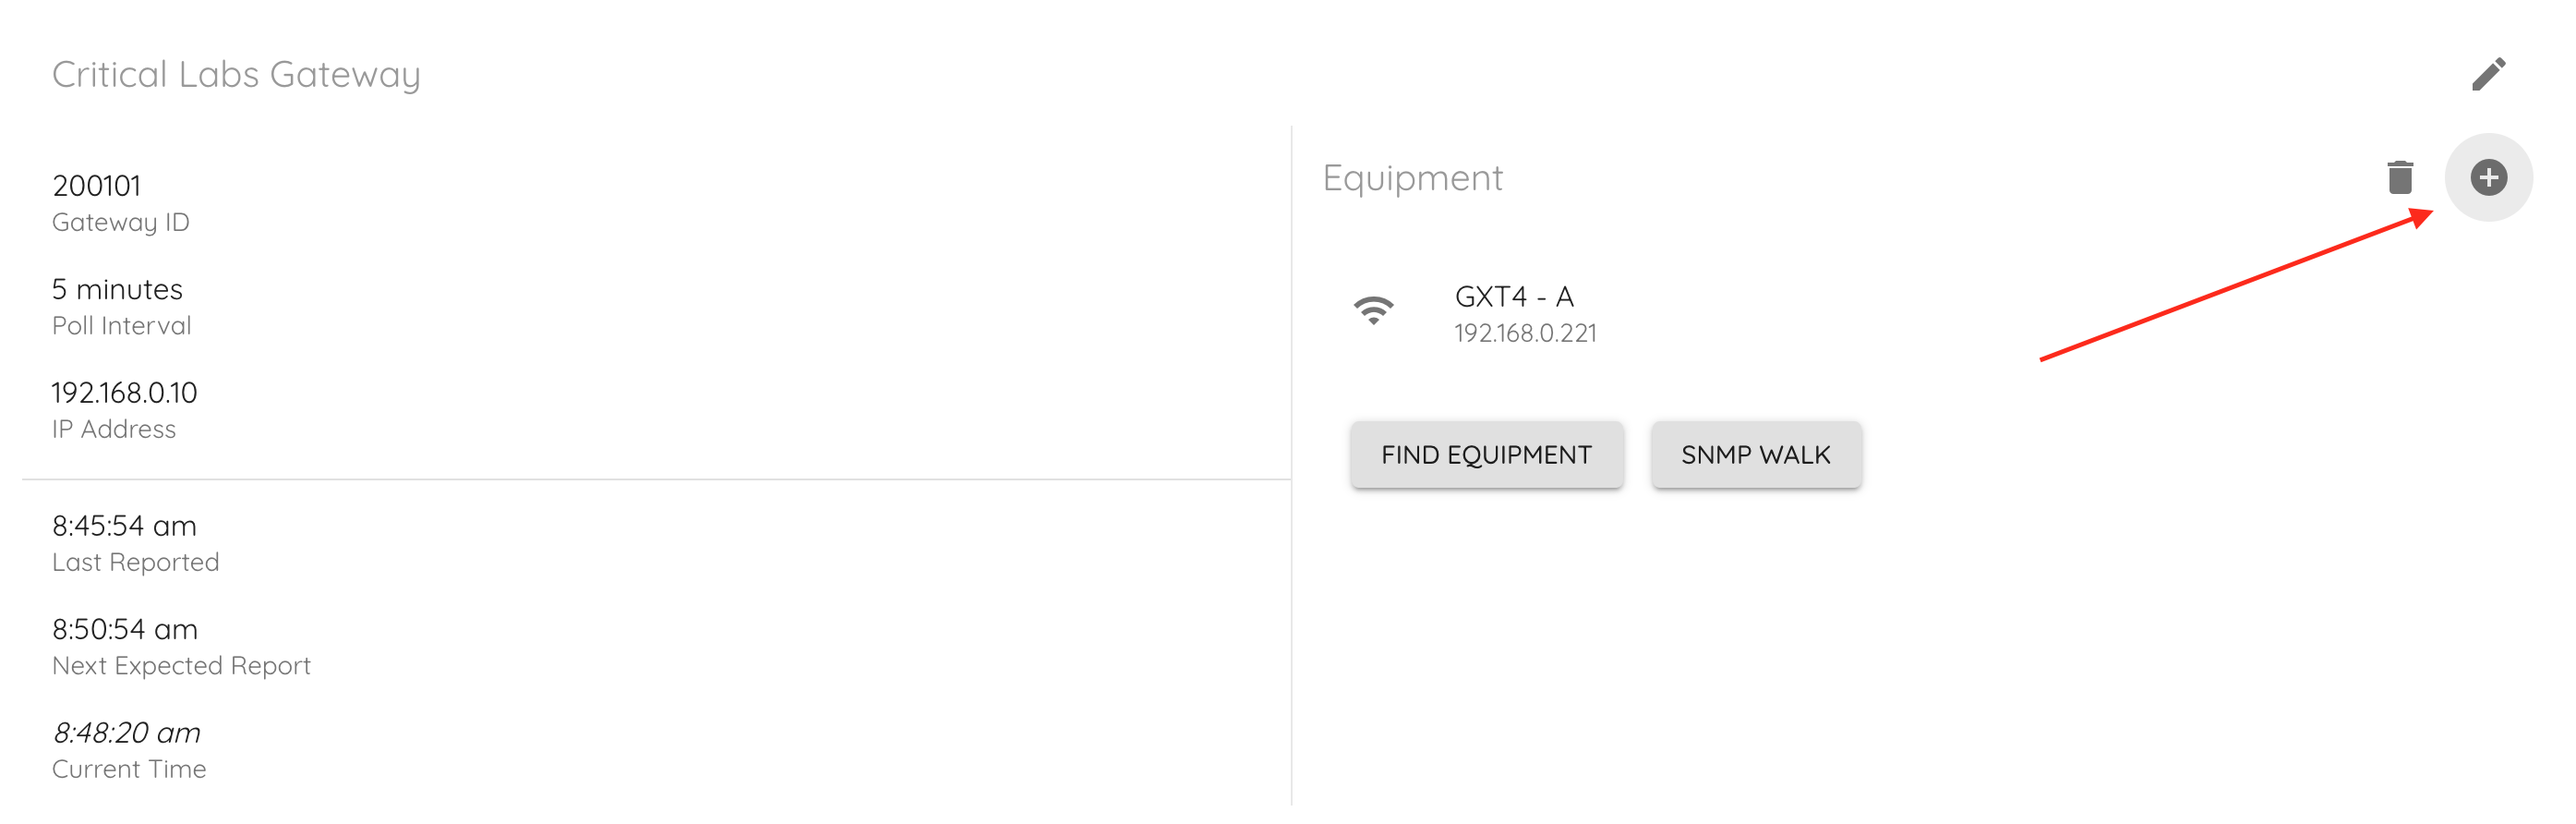
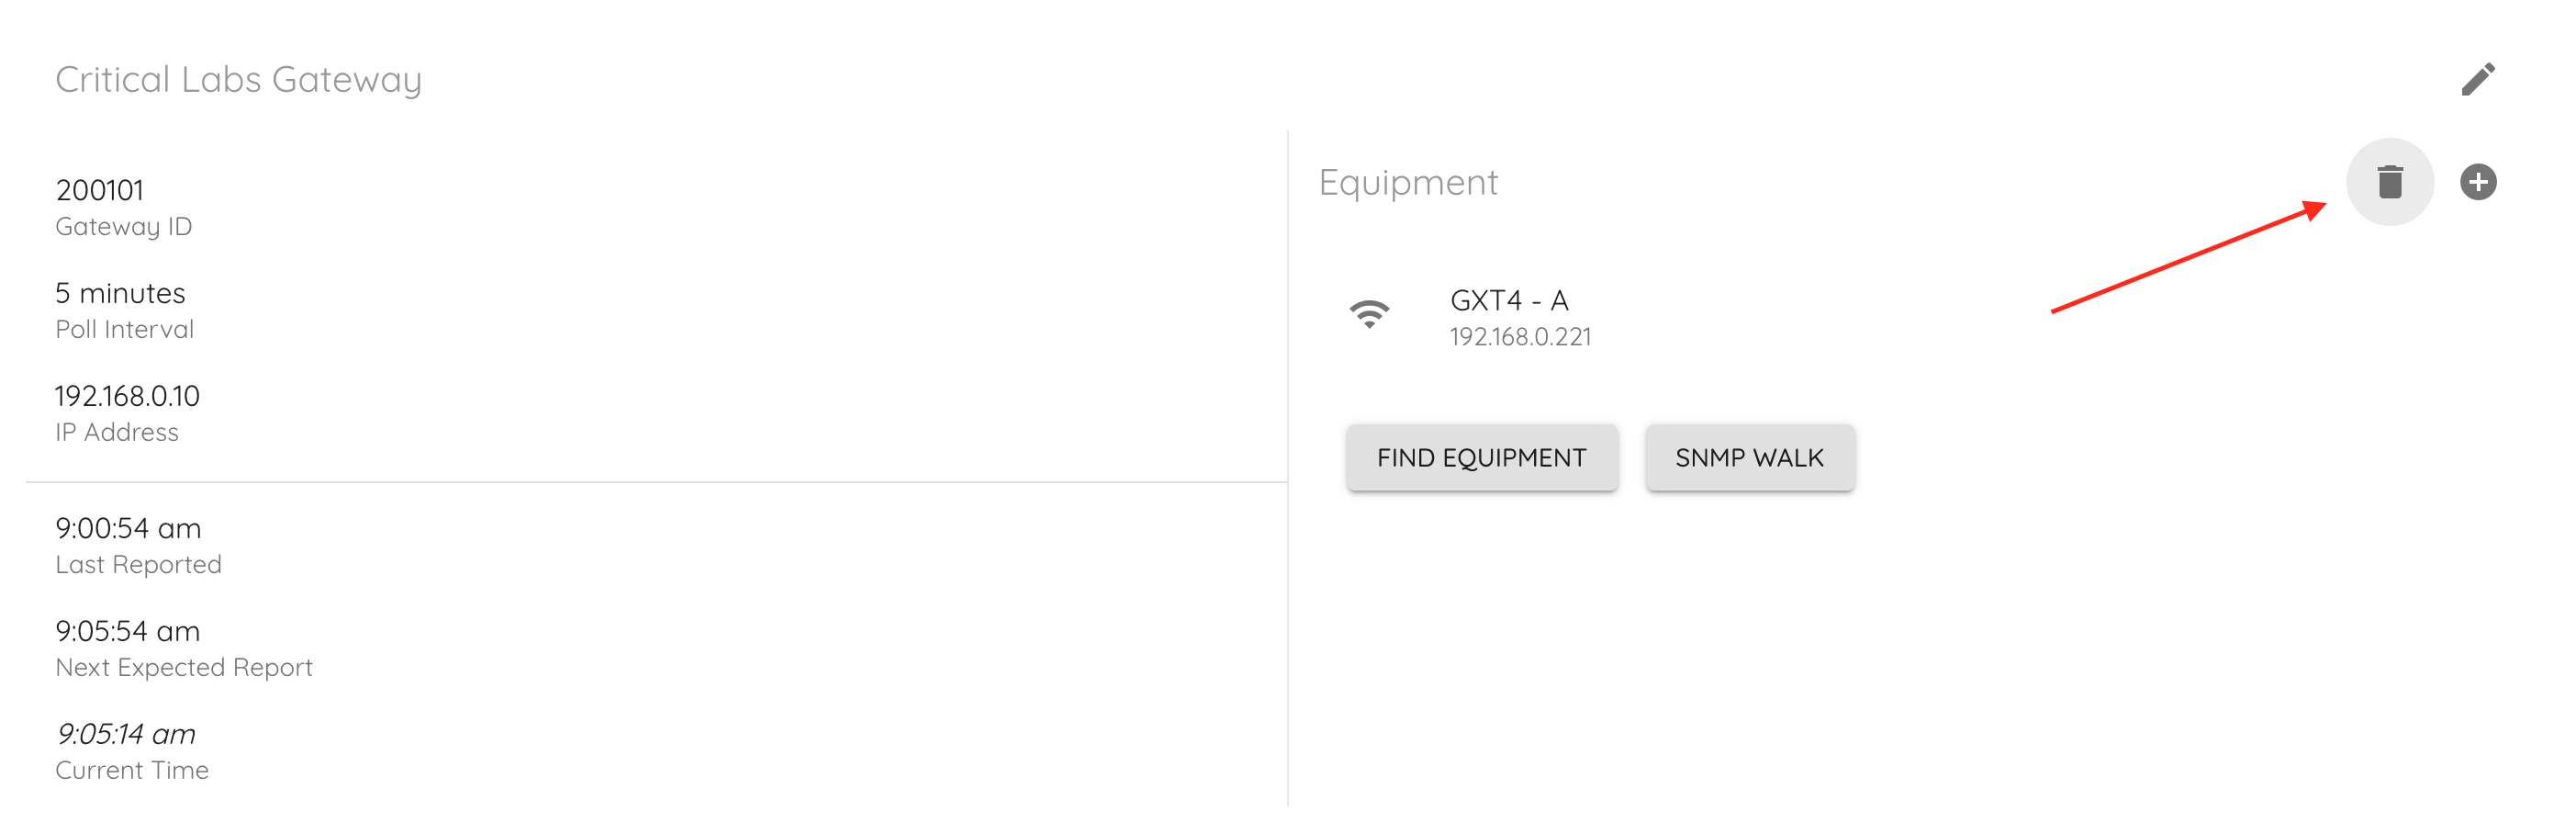
All equipment that has been connected to the gateway can be found under the Equipment header on the Gateway page. From here you can get a quick glance at the connection status of the device, and it's IP address. You can also add, remove, or search for devices.
Viewing Equipment Info
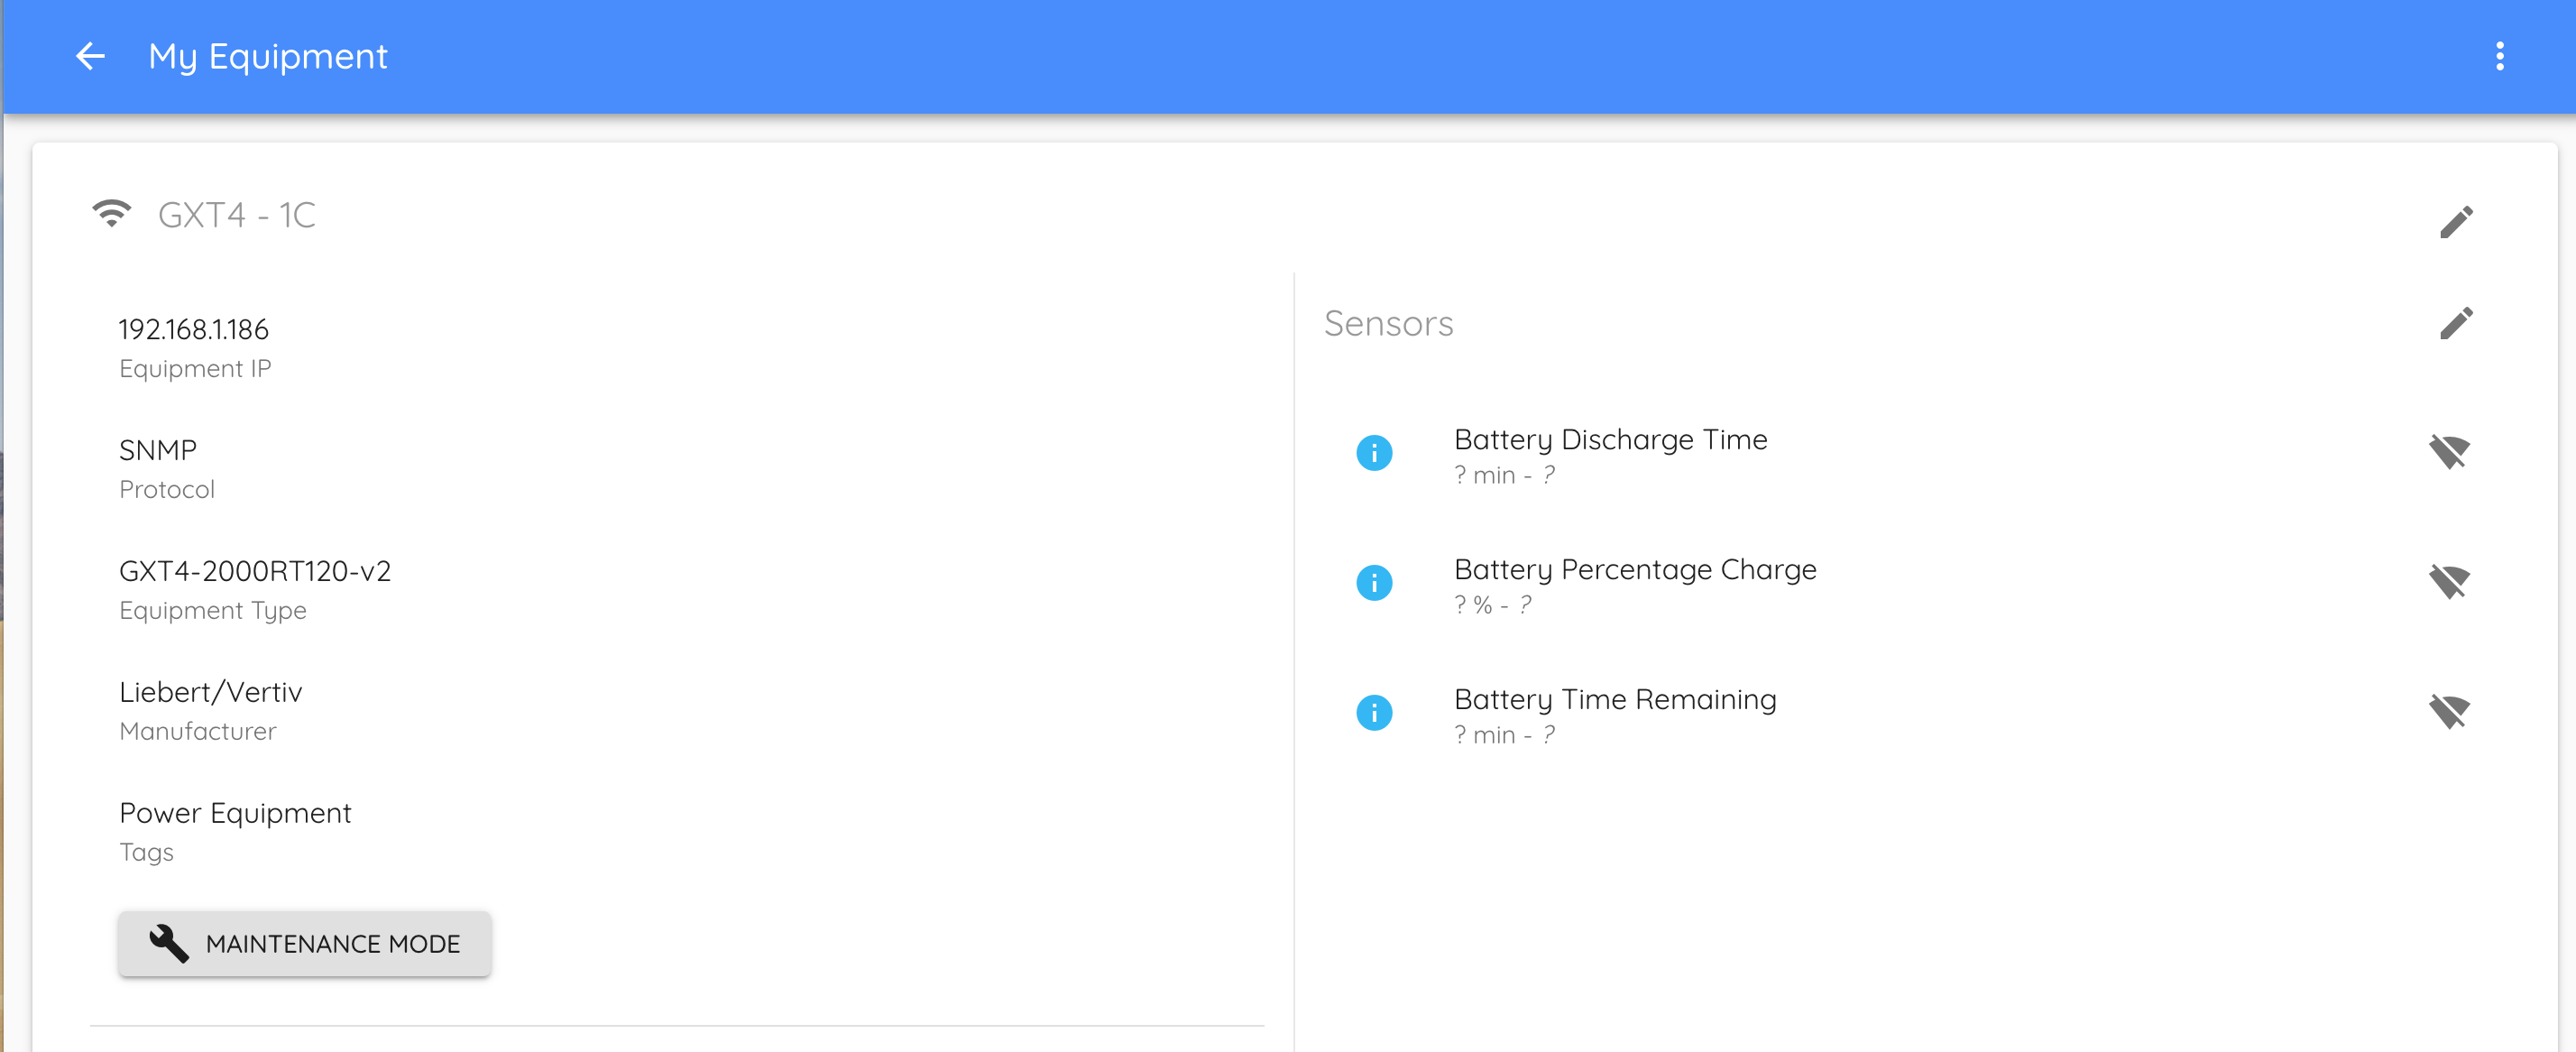
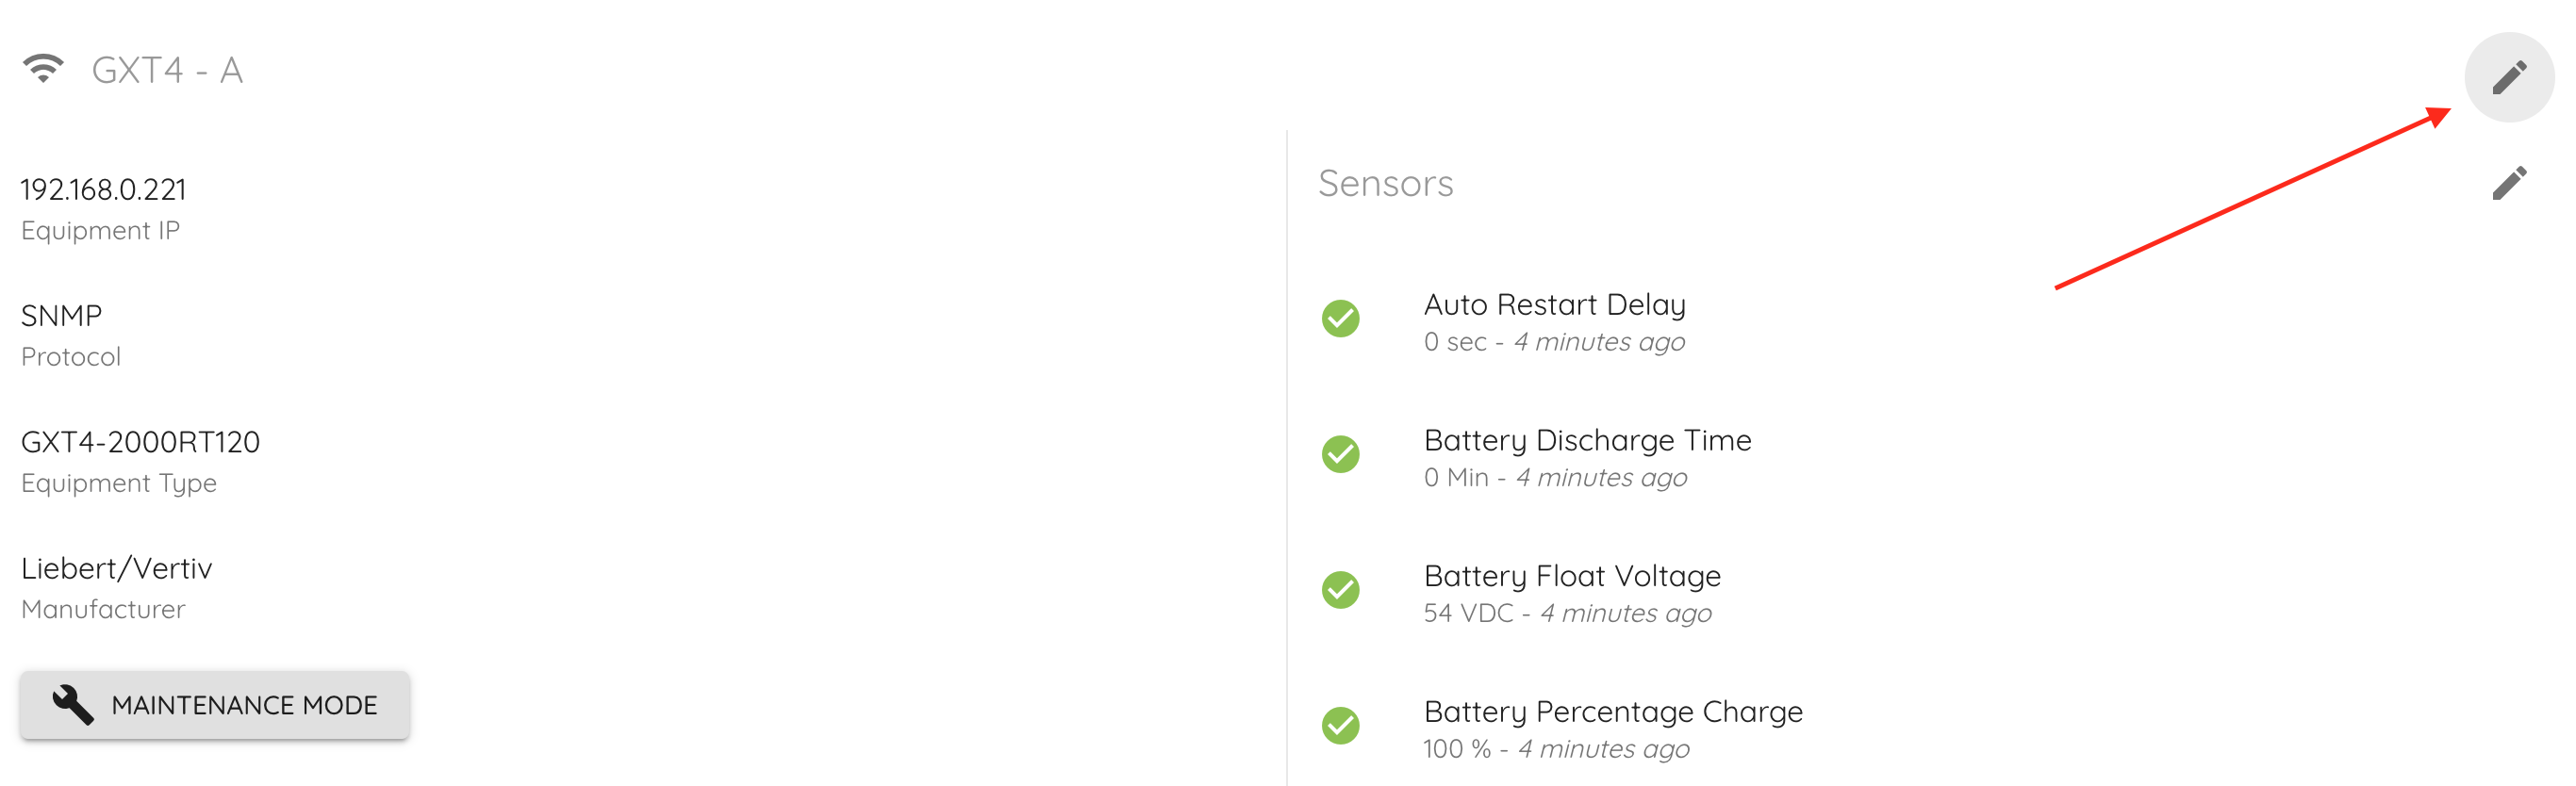
If you clicked on a piece of equipment on the gateway page, as described above, then you should now be at that equipment's status page. This page displays information about the equipment on the left and a list of sensors that are being monitored by Critical Labs on the right. There are a couple of actions you can take on this page, which are described below.
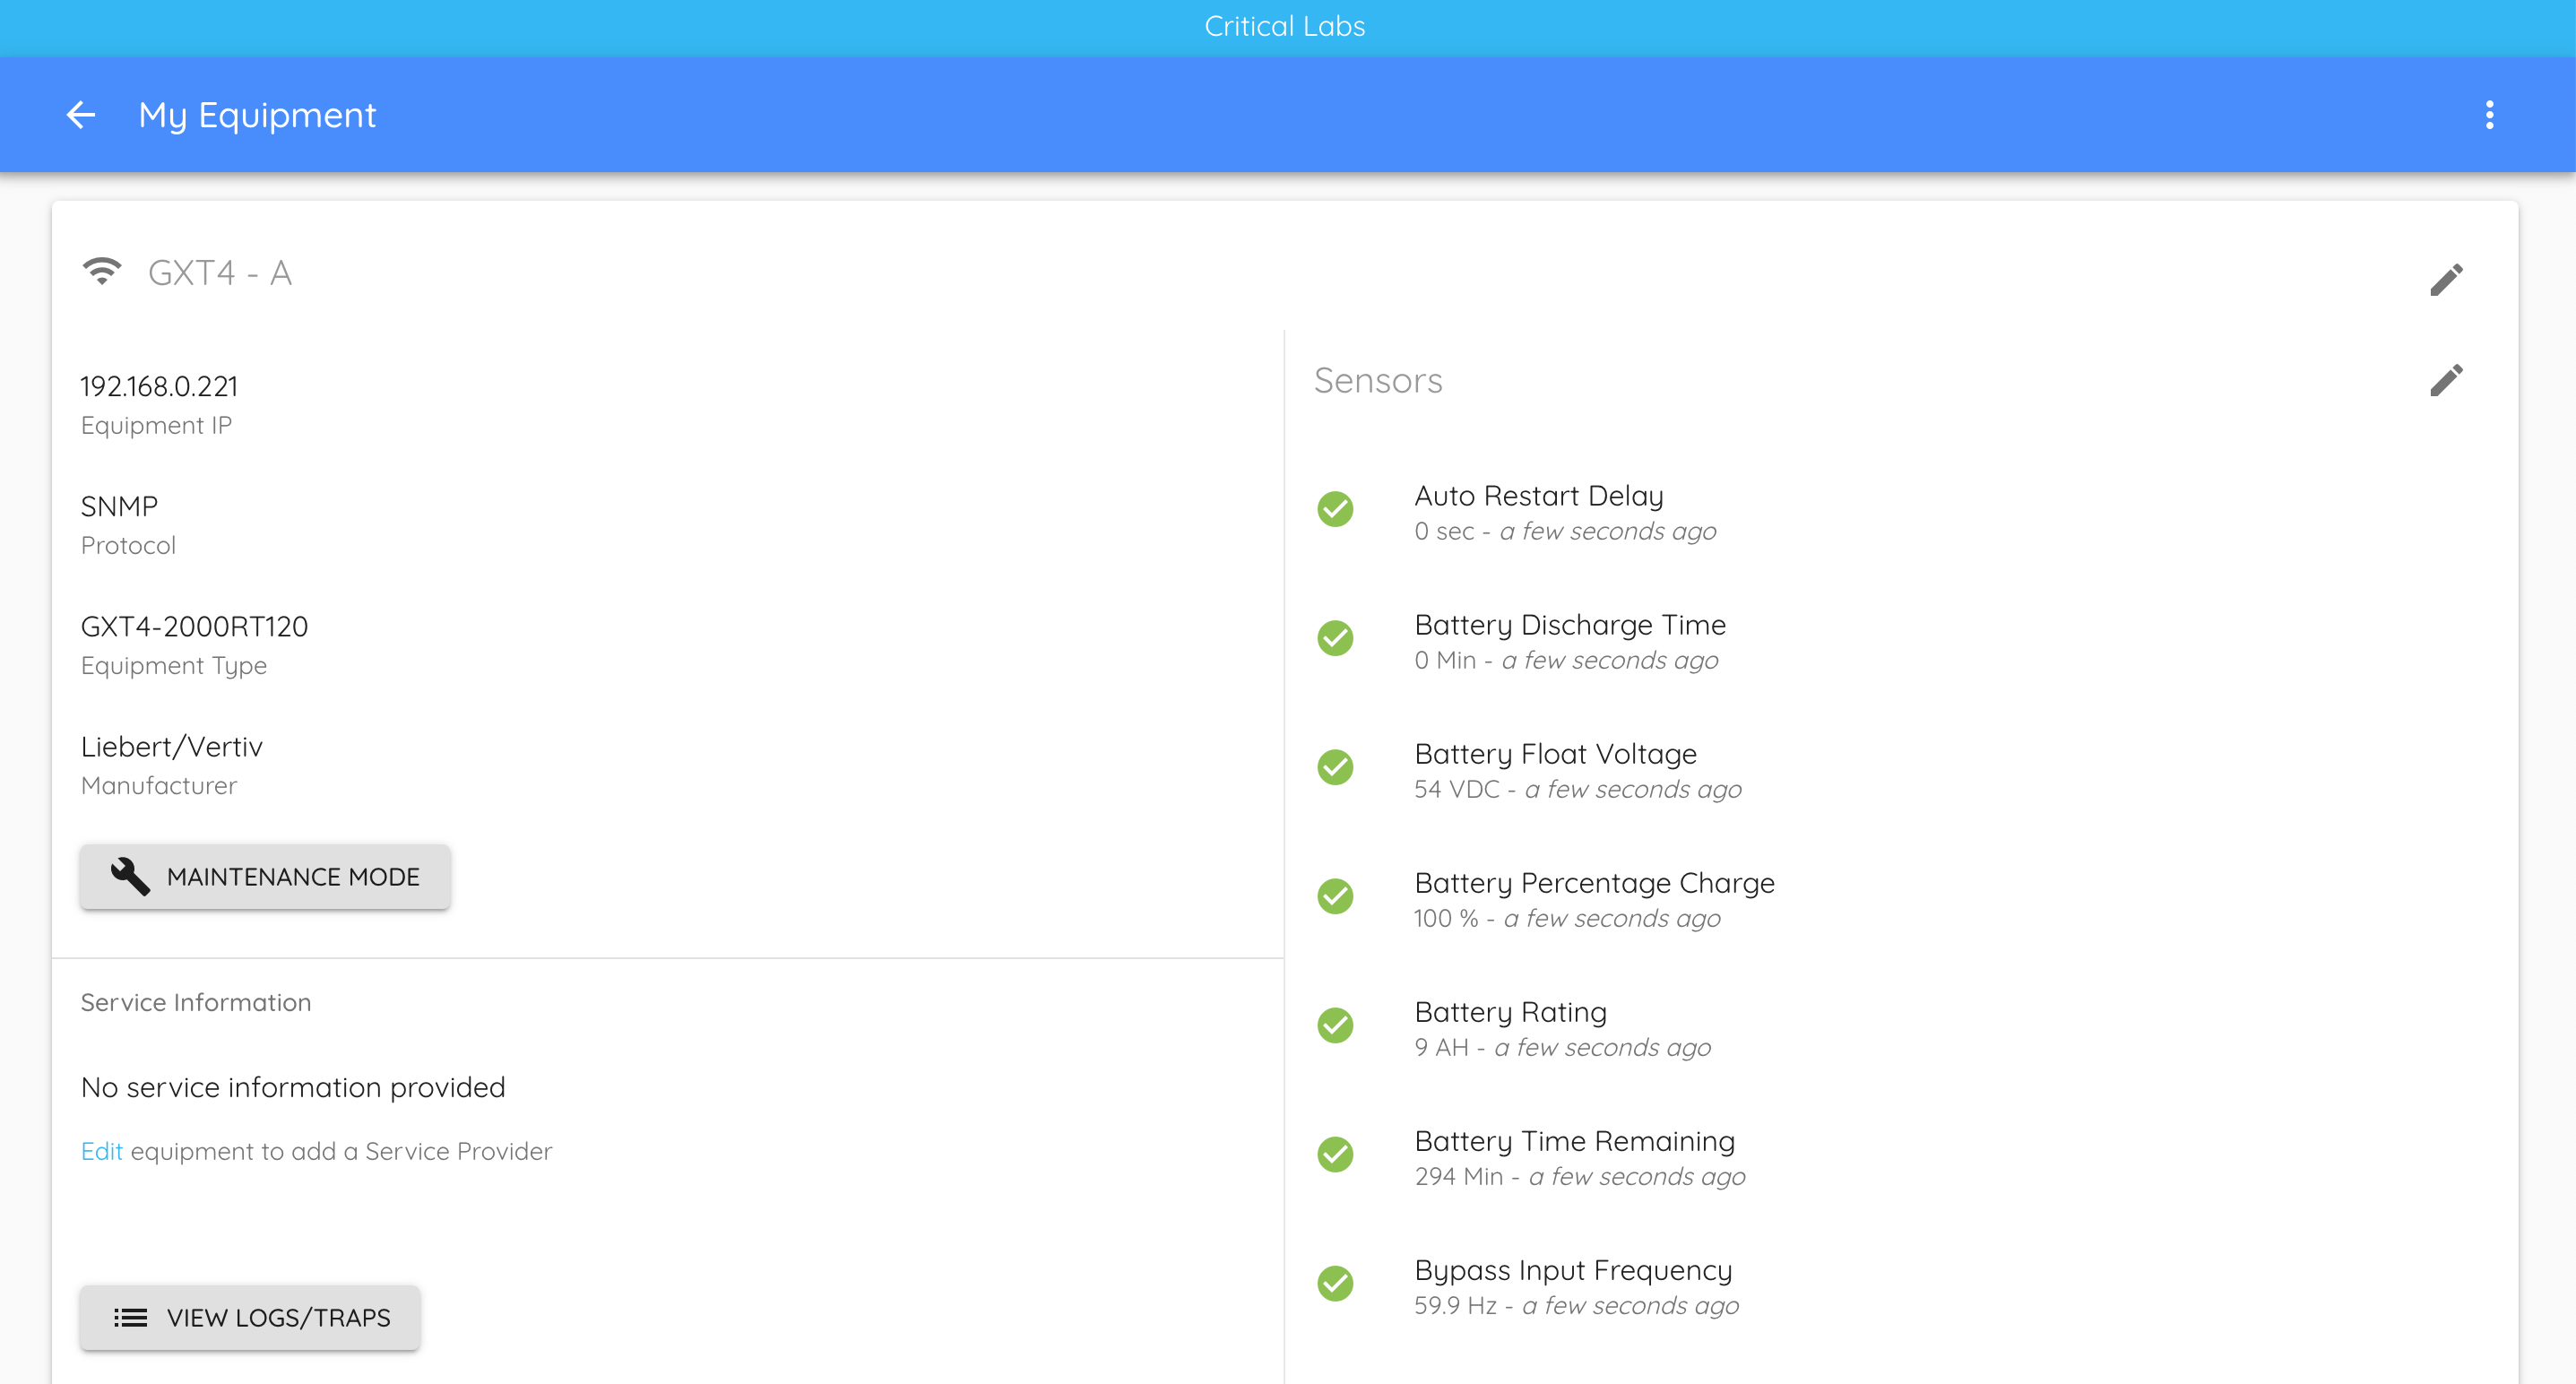
Maintenance Mode
You can put equipment into maintenance mode, which will disable alerts from Critical Labs while it is enabled.
View Logs/Traps
This button allows you to see a log of alerts that Critical Labs has detected on this piece of equipment (shows the 50 most recent alerts). These are not the same as the equipment's internal alerts log - these are merely a history of alerts that Critical Labs has received from sensors that it is monitoring. It is color-coded to help visually distinguish types of alarms (other than that, the color has no meaning).
If you have a SNMP traps configured to send from your equipment to Critical Labs, then Critical Labs will list these traps here. Traps can be very useful for diagnosing specific problems on a piece of equipment.
Adding Equipment
To add a new piece of equipment, navigate to your gateway's status page. Select the Add button to the far right of Equipment.
You will be prompted to select a Manufacturer and Model for the equipment.
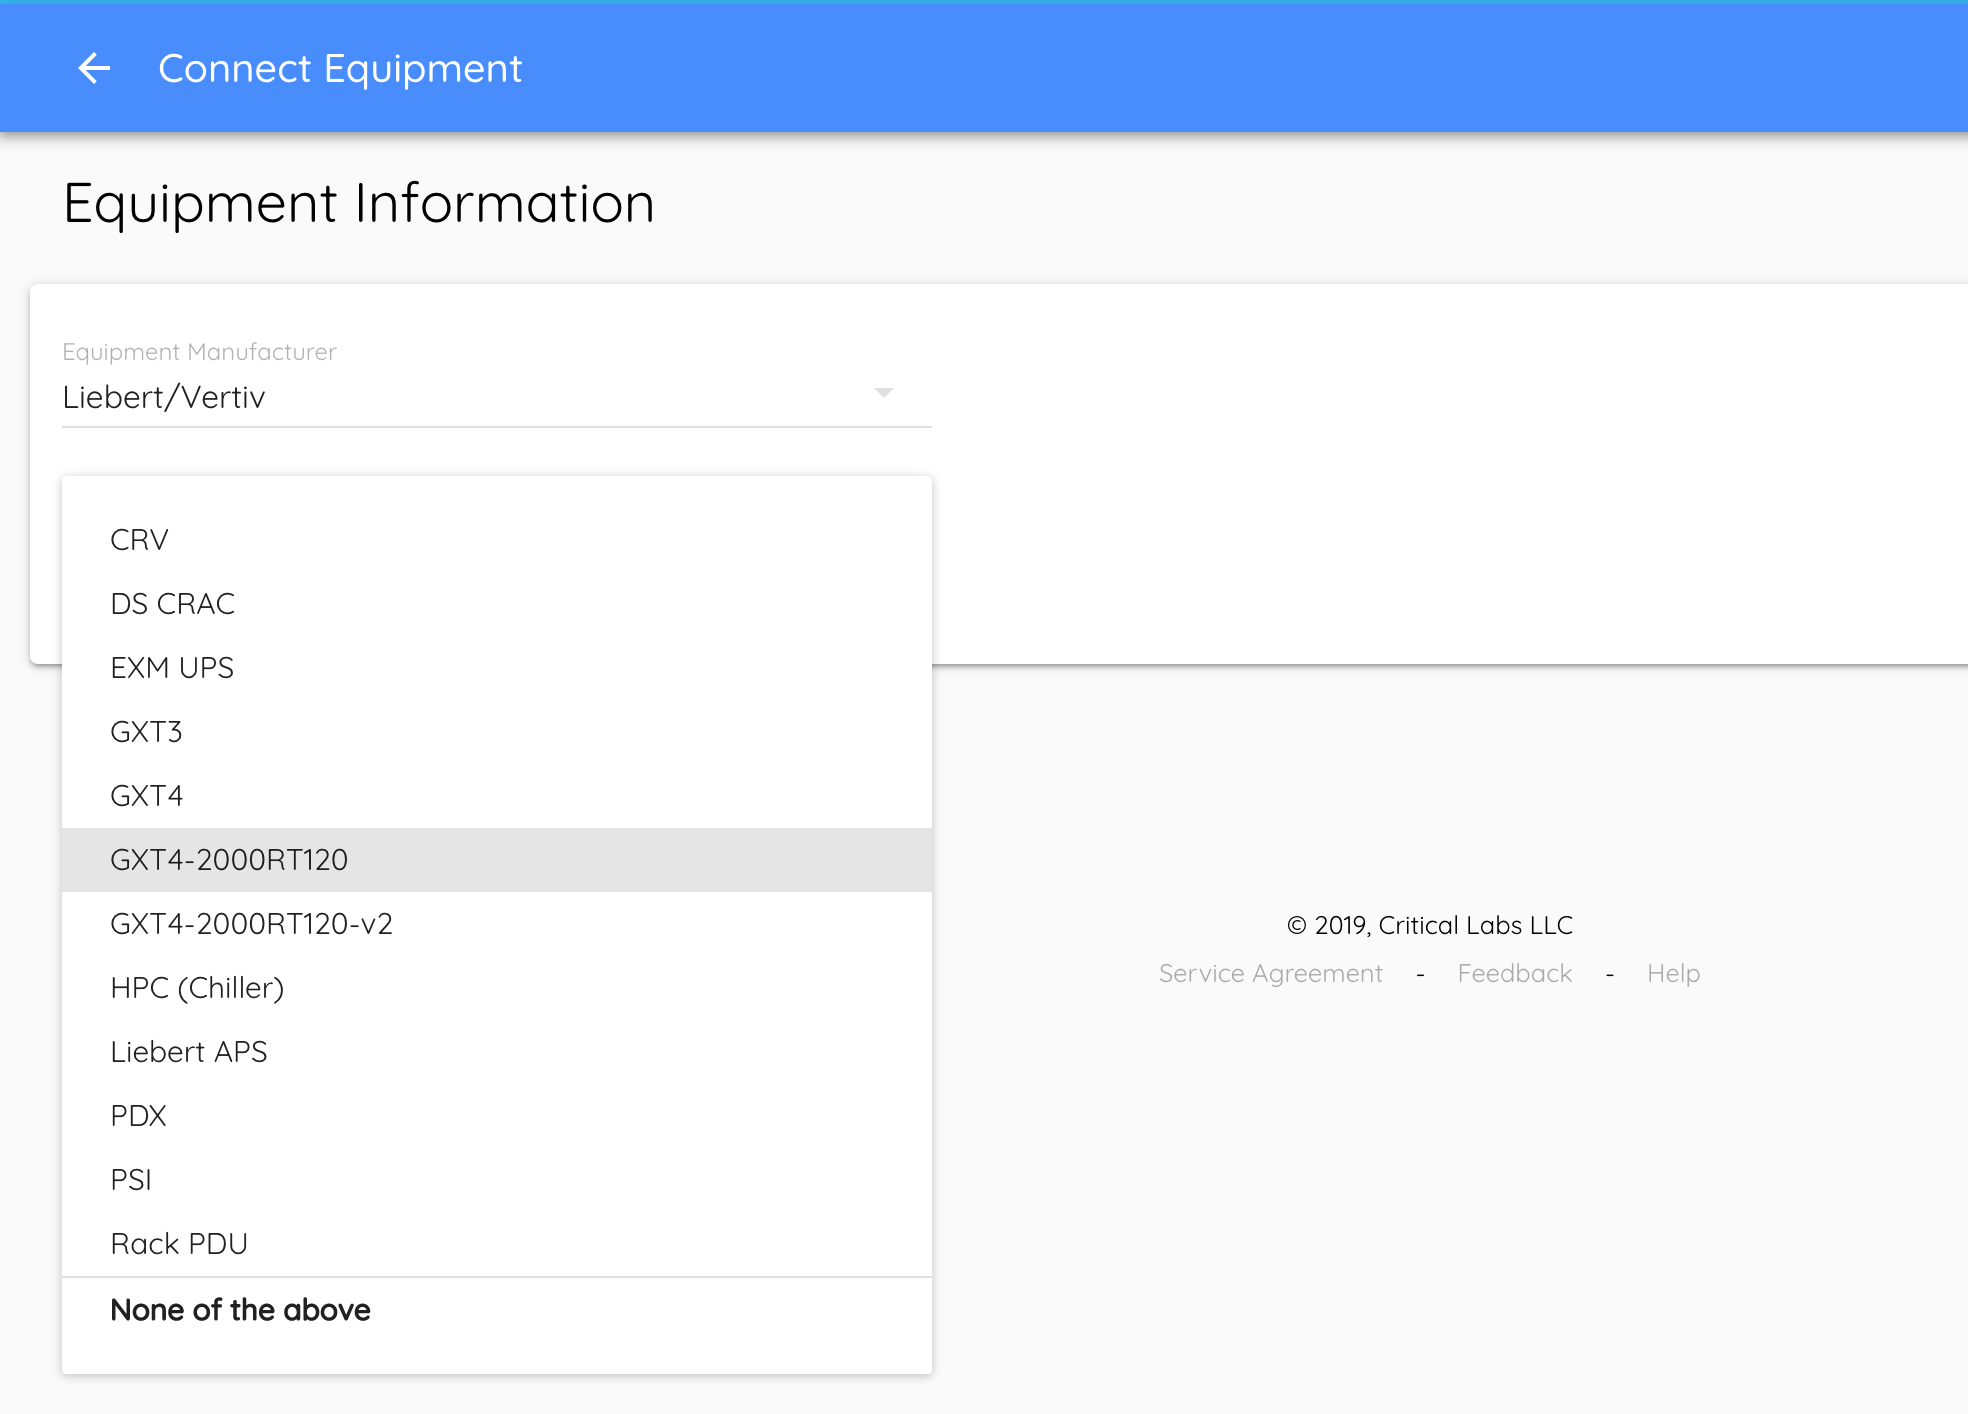
Critical Labs maintains a growing library of manufacturers and equipment to help make the connection process easier. You may find that your equipment's manufacturer and model are already in the system. If they are not, then you will need to tell Critical Labs about your equipment by creating a library.
Creating a Library
A library is a predefined connection template assigned to a specific model of equipment. It includes protocol information, which helps Critical Labs know how to grab data off of your equipment. Once a library is created, it can be reused for any other equipment of the same model.
To create a new library, select None of the above from the Equipment Model drop down list (shown above). The application will walk you through the steps to create the library. This is an advanced process and requires basic knowledge of Modbus and/or SNMP. For more information, you can reference these documents on creating libraries:
Back to Adding Equipment!
For the purposes of this walkthrough, we are going to assume that your piece of equipment is already in Critical Labs. You will need to select your manufacturer and model from the dropdown menus. Once selected, you can select:
- Your desired network protocol (Modbus or SNMP)
- If the protocol is not supported, then we're back to adding a library
- IP Address of the piece of equipment
- A suitable name for the device
- Other specific protocol information
View Templates
Some equipment has an option to select a View Template by selecting the "Create a view for my <equipment name>" while you are adding the piece of equipment.
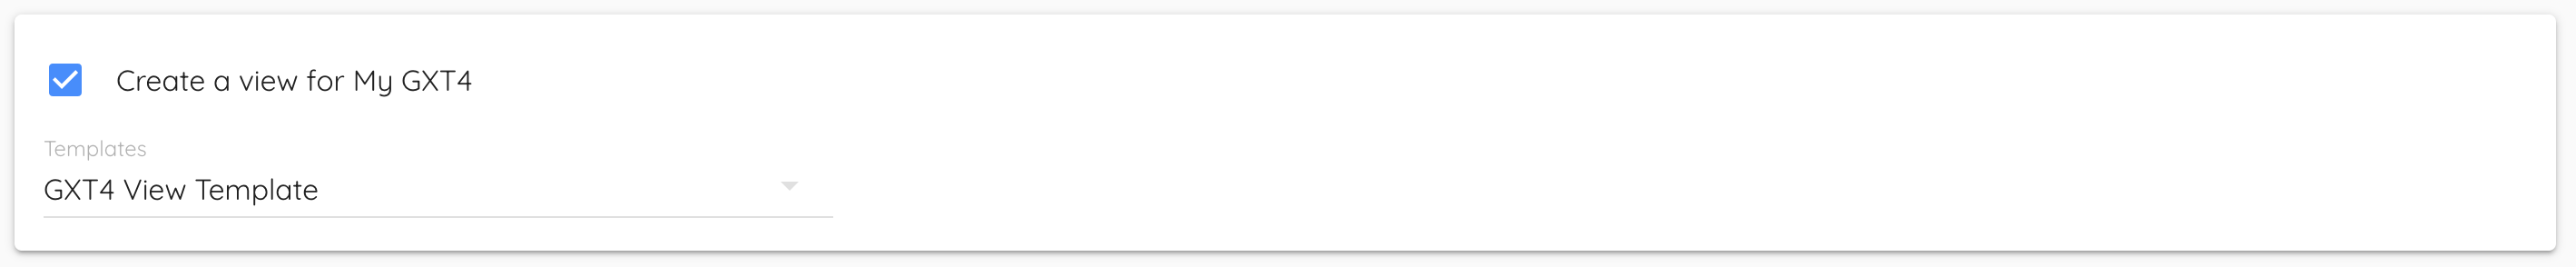
This is a pre-defined view made by Critical Labs. We recommend selecting a View Template when it is available. It saves you from having to build a view from scratch.
Click Save.
Adding Sensors
If you did not select a View Template, then you will be taken to the Add Sensors page.
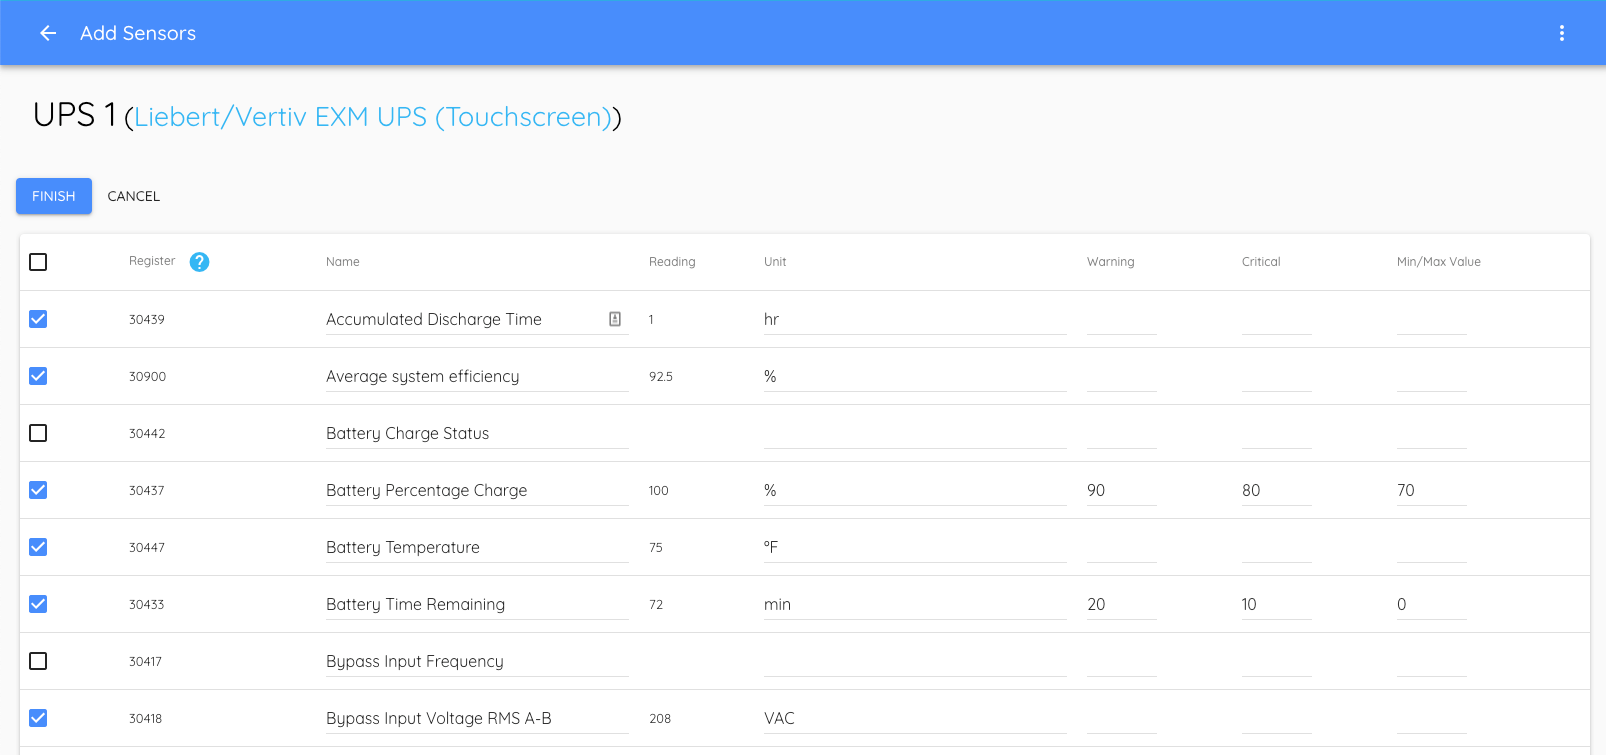
This is where you select all the sensors that you would like to monitor. Once you have finished selecting the sensors (these can be updated later), click Finish.
This will take you to your newly created equipment's status page. You may notice that all the sensors have a disconnected icon to the right of the sensor name - these should go away on the next gateway poll, after the gateway has had an opportunity to read the data.
If they do not go away after five minutes, then something was configured improperly or the gateway is unable to connect to the piece of equipment. To troubleshoot this, visit Why can't my Gateway see my equipment?
If you selected a View Template, then a pre-defined set of sensors will automatically be added to Critical Labs and you will be taken to the newly created view instead of going to the Add Sensors page.
Editing Equipment
If you ever need to make changes to the connection information to your equipment or to its name, then you can edit the equipment from the gateway status page.
 Simply select the uppermost edit icon (the lowermost will let you edit the sensors that are connected to your equipment) then select the equipment you want to edit by clicking on it. Once you have made your changes, don't forget to click Save at the bottom of the form.
Deleting Equipment
From the Gateway page, select the delete icon to the right of Equipment. Each equipment will now have a delete icon next to it.
Select the delete icon to the right of the equipment that you wish to delete. *Note: this will delete the equipment AND all of the sensors attached to this equipment. Delete with care!
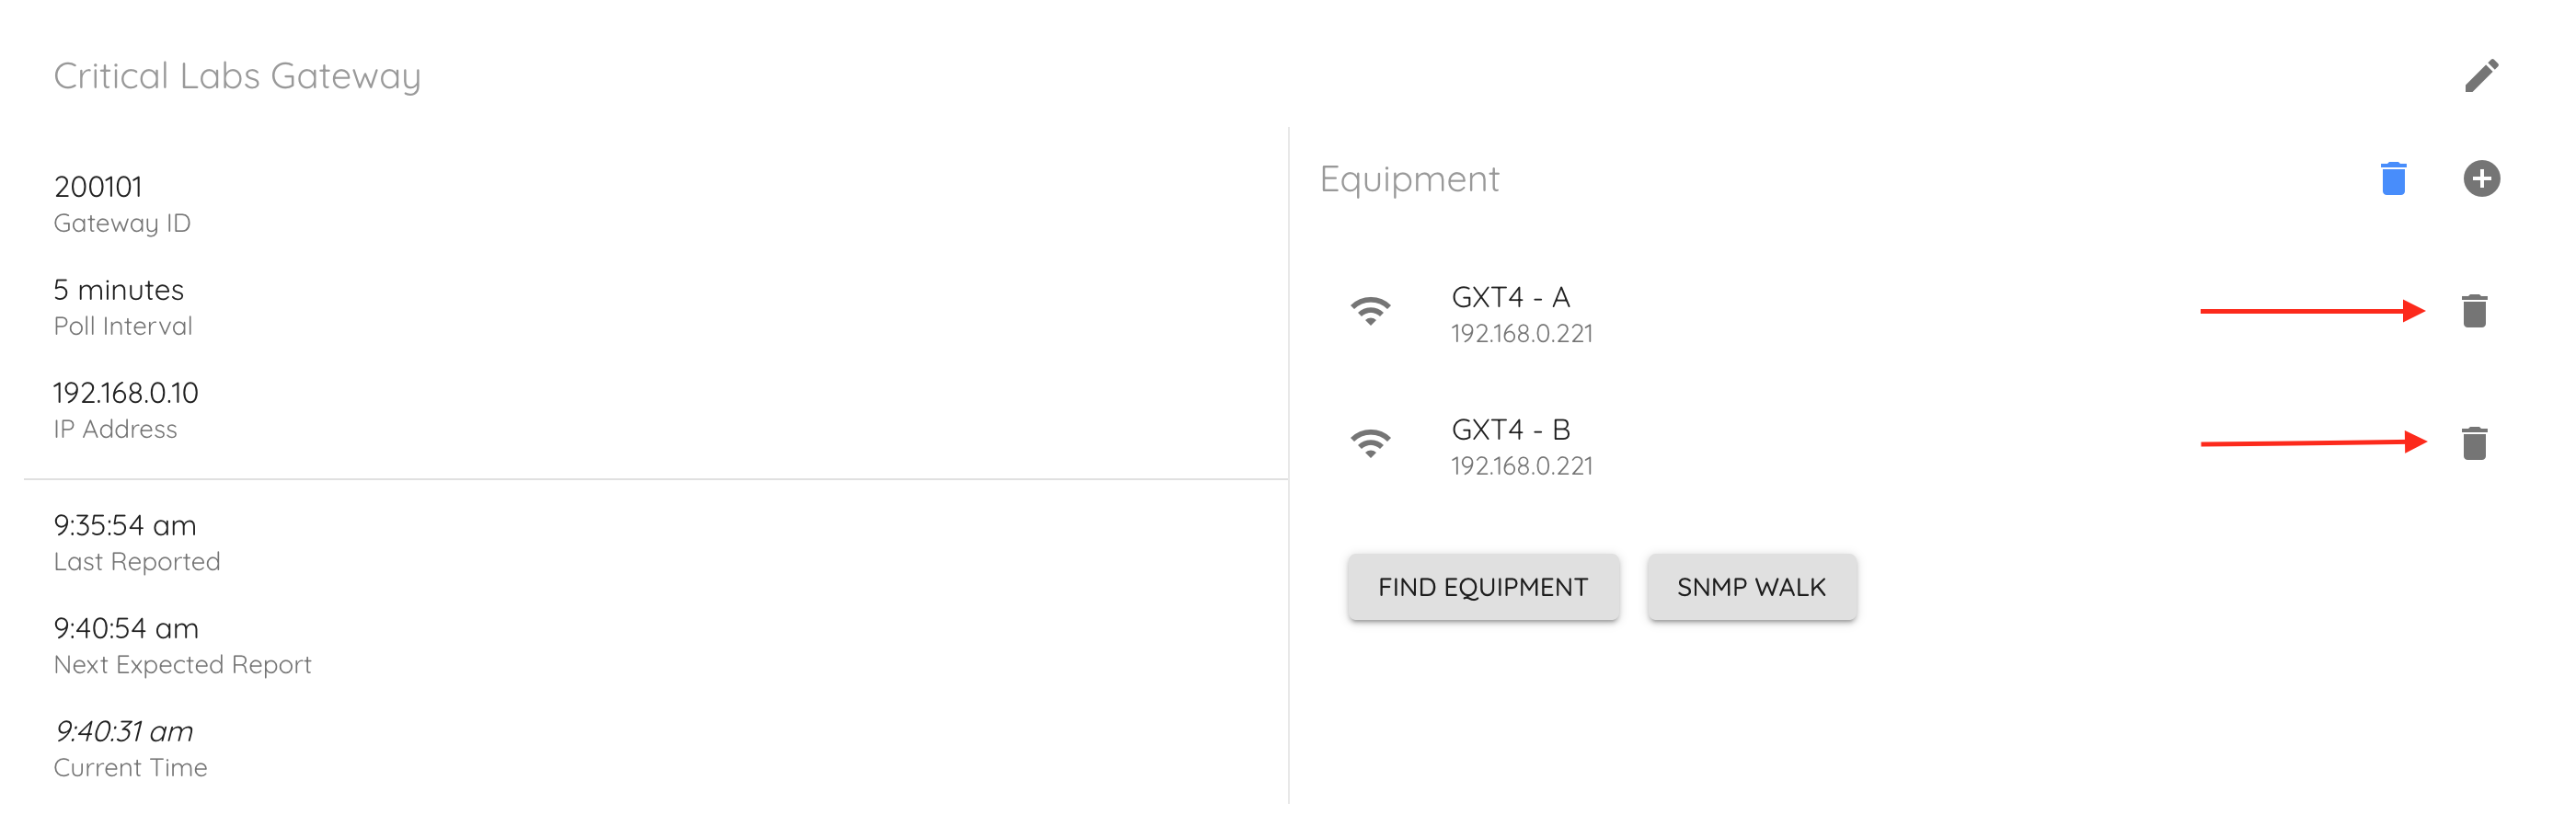
Once you have finished removing the equipment, click the blue delete icon to stop deleting equipment.
Next Up -> Managing Sensors
Comments
0 comments
Article is closed for comments.